To consult energy performance of outdoor units
1 | From the site selector, select the site to which the outdoor unit is associated. |
2 | In the navigation pane, select under . |
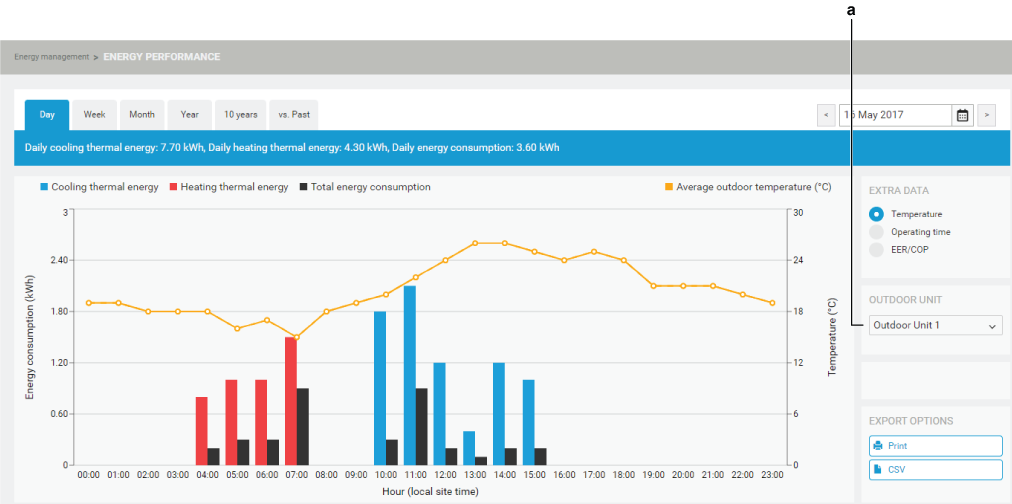
- Result: The energy performance of the current day is displayed for the selected outdoor unit.
- Result: You can see the cooling (blue) and heating (red) thermal energy consumption, the total energy consumption (black) and the average outdoor temperature (°C) in yellow.
- Result: If the site has multiple outdoor units associated to it, you can select the outdoor unit you wish to display data for from the drop-down list (a).
3 | Click any of the labels in the legend to hide them from the graph. |
- Result: The label(s) will be grayed out (b) and the values are hidden from the graph as shown below. When you hover your cursor above the energy consumption bars, the details (c) are shown.
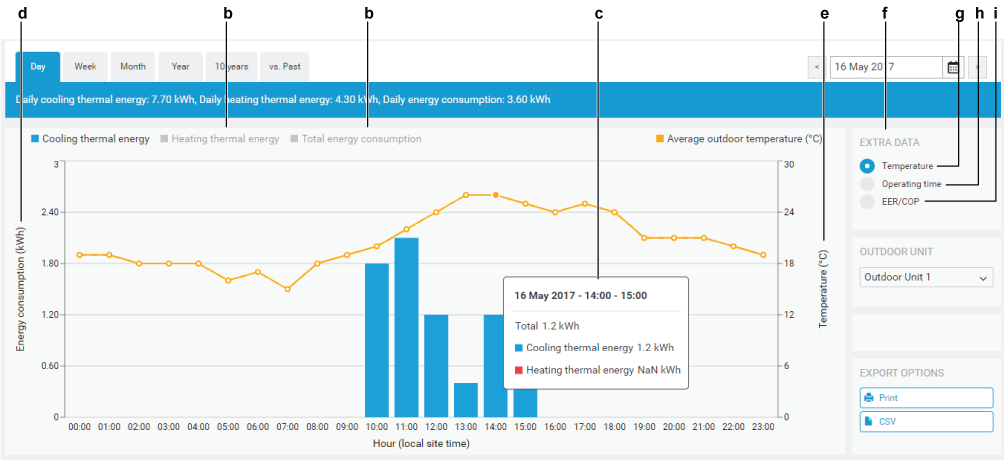

The left Y-axis (d) always shows the Energy consumption (kWh). The scale might change as you hide one of the values. This might give the impression the values changed.
The right Y-axis shows the (e) if you choose the option (g) in the field (f). When (h) is selected, the Y-axis will show the operating time in minutes or hours, depending on the selected time period.
If charts contain a dashed line it means there is a gap: the unit was off and could not do any measurements.
Daikin affiliates and higher have the ability to select EER/COP (i) as a third option under (f). When selected, the energy efficiency ratio and the coefficient of performance are displayed on the right Y-axis.
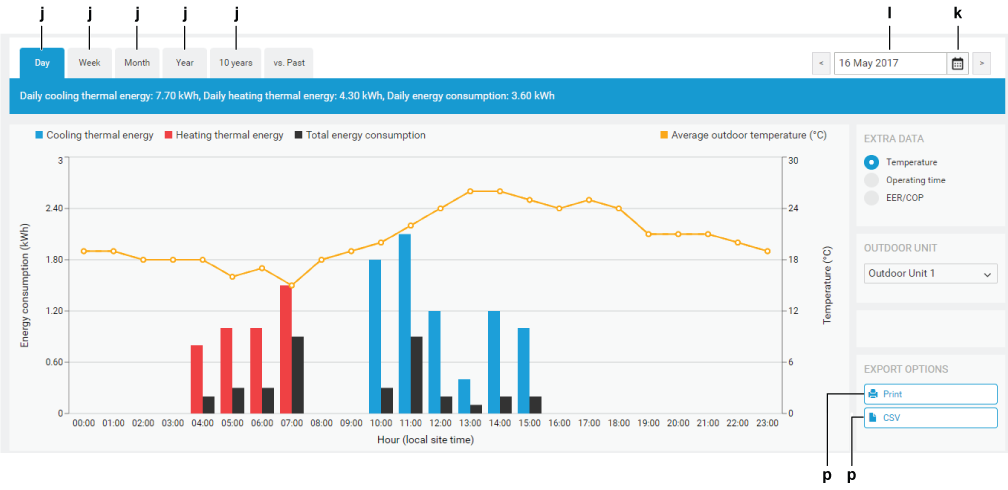
4 | Click the labels in the legend (b) to show the information again. |
5 | To consult the energy consumption of another period (day, week, month, year), select one (j) at the top left of the section. Click the calendar icon (k) to select the desired day, week, month or year. You can also type directly in the calendar field (l). In that case, confirm your input by pressing ENTER on your keyboard. |
6 | To compare the energy consumption of preceding years, click (m). |
- Result: 2 calendar fields (n) become available, allowing you to select the 2 years you want to compare.
7 | Select the years you wish to compare. You can also choose the starting month (o): this will only determine which month is visualised as the starting point for the chart. The graph still displays the data for a whole year. |
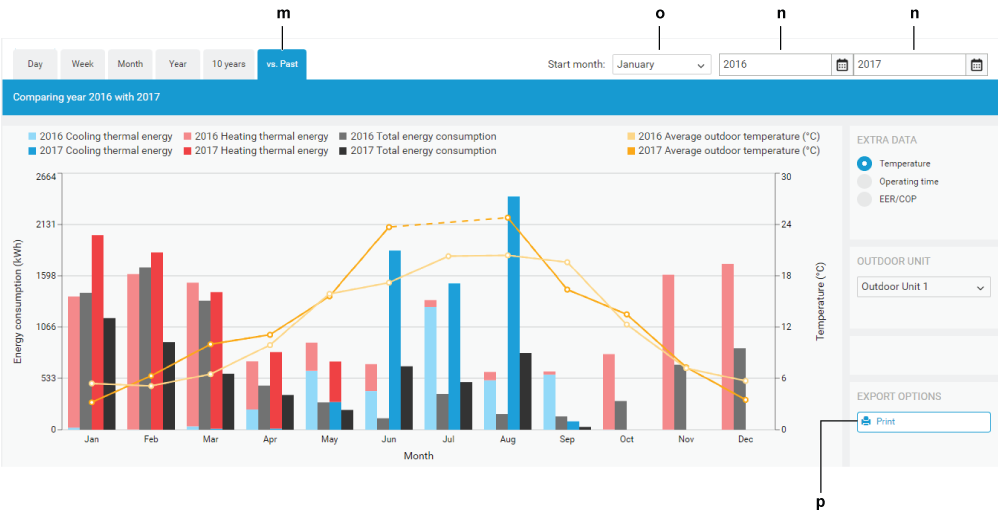
When comparing with the current year, ONLY data up to last complete month is taken into account.
8 | You can print the currently visible chart or export data to CSV format by clicking either of the corresponding buttons (p) at any point. |
