To manage the alarm history
The alarm history gives an overview of all warnings and errors that occurred on your available sites.
Controllers are constantly monitoring the units at the sites. They detect alarms (such as moisture alarms) and transmit these to the cloud at regular intervals (for example, every 2 hours, as long as the alarm is not acted upon). In case an IEQ sensor has been paired to any of your sites, its alerts will also be transmitted.
Alarms always enter the system with the status.
1 | In the navigation pane, select under . |
- Result: An overview of the alarms at your sites is displayed.

This window allows a lot of filtering and sorting and has 2 different views:
- Grouped view (a) gives a clear overview; the alarms are grouped, based on the . This means that the site and the unit are the same but there are multiple occurrences (b). The number in the column shows the amount of identical alarms.
- Flat view (c) shows all the alarms separately.
2 | To change the period for which you want to view alarms, edit the or date by clicking the calendar icon (d). |
3 | Use the filters on top of the table to display only particular information. |
4 | To only view particular sites, alarm types or task statuses, select a value from the drop-down lists (e.g. to only view sensor alerts for a specific site). |
- Result: The application will only display the alarms that correspond to the value(s).

5 | To remove the filter again, click the small X in the drop-down list (e). |
6 | In the fields without a drop-down list you can simply type a value (e.g. field). |
- Result: The application will only display the alarms that correspond to the value(s).

7 | To clear all filters, click the white X at the right (f). |
8 | To show certain alarm information directly in this overview page, click the vertical ellipsis icon (g). |
- Result: A drop-down list appears, showing all other alarm information labels.

9 | Select the information you want to display in the overview window. |
10 | To consult all details of an alarm or sensor alert in 1 window, click the eye icon (h) on the right of the corresponding row. |
- Result: The following section appears.

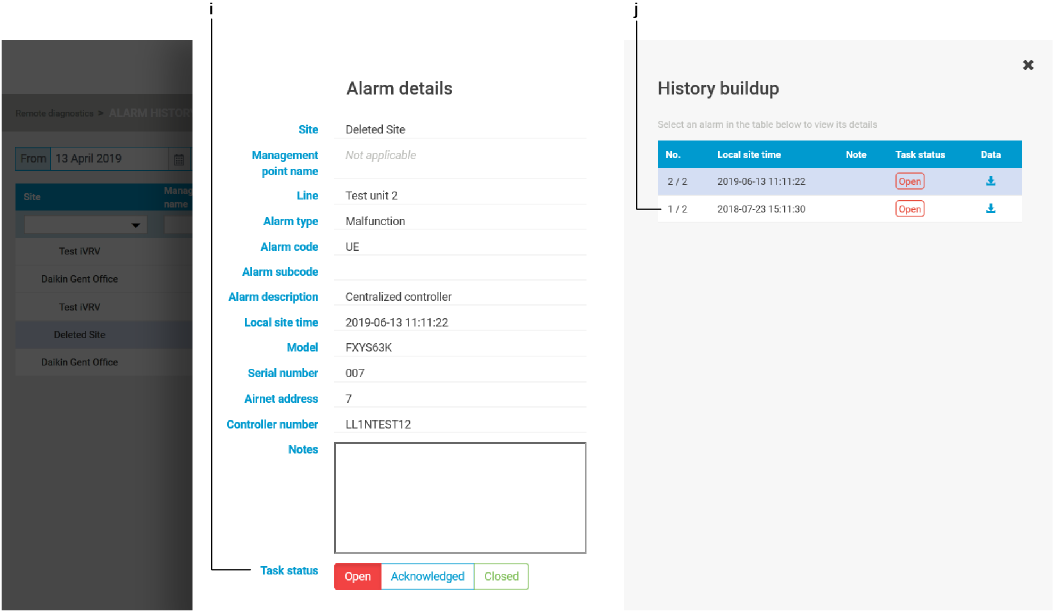
In this window you can change the status (i) of the task (//) and consult all the details of each alarm occurrence.
Under (j) you can see when the alarm was first transmitted by the controller. The controller will of course only stop transmitting the alarm once it has actually been resolved on the unit, not when you change the task status to or in the application.

No matter which alarm occurrence you select in the list, closing will always only affect the latest transmitted alarm occurrence.
If you close an alarm before it has actually been resolved on the unit, a new alarm line will be started on the page, even though it is the same alarm.

Do not forget to close an acknowledged (and technically solved) alarm, otherwise you will no longer receive an email if the exact same alarm reoccurs later on the same unit.

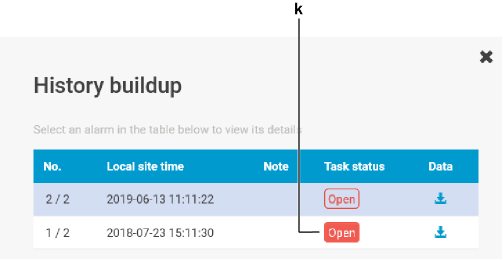
You can reopen acknowledged and closed alarms, or even manually mark alarms as open: in that case the button (k) is colour filled.

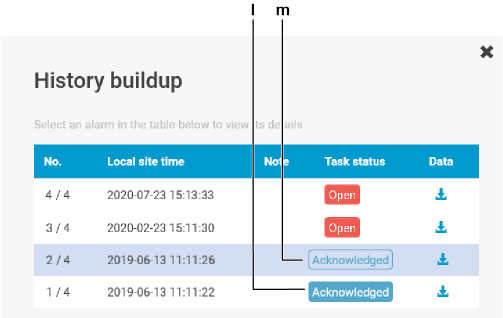
There are also 2 colour patterns for and buttons:
- Manually marked alarm events (l) are colour filled.
- Alarms that are automatically acknowledged after a preceding alarm has been manually acknowledged (m) are hollowed.

The controller keeps sending occurrences as long as the error is not technically solved.

The sensor alerts of IEQ sensors are ALWAYS automatically marked as closed.
Users who are assigned to a site will receive an email each time a controller transmits an open alarm. By acknowledging, that user will no longer receive emails about this particular alarm. Logically a technician will now be sent on-site, but as long as he does not arrive and take action, the alarm will now come in as an acknowledged alarm.

