To compare multi-site combined energy consumption
Via the module you can compare the energy consumption of the different outdoor units at all the sites you have access to. The charts will show the aggregated data.
1 | In the navigation pane, select under . |
- Result: The annual energy consumption summary for all sites combined is displayed..
- Result: The grey line (a) indicates the cumulative energy consumption.
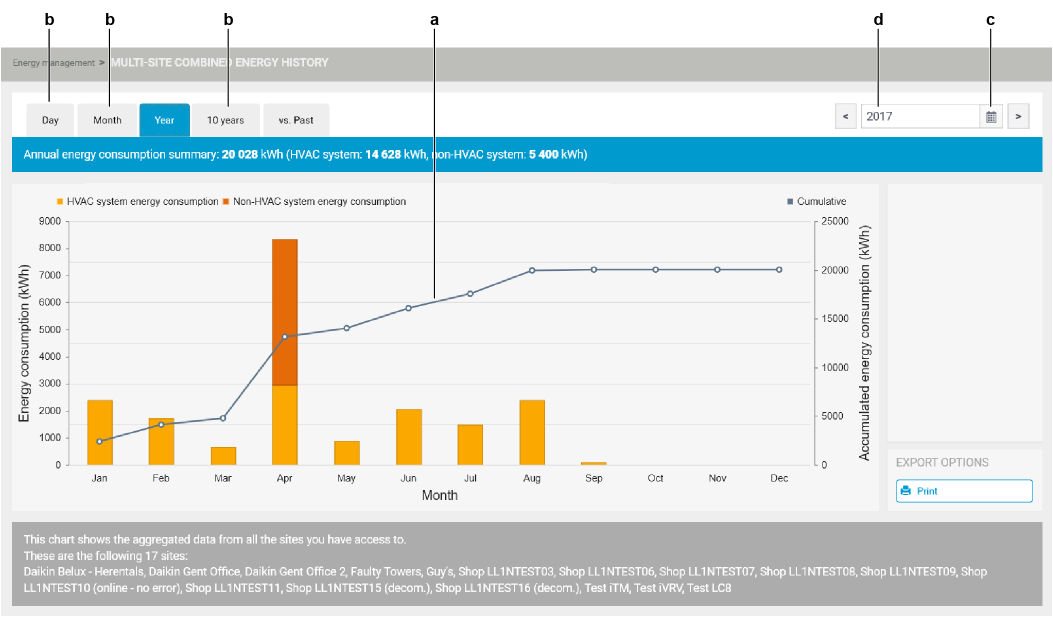
2 | To consult the multi-site combined consumption of another period (month, day, 10 years), select one (b) at the top left of the section. Then click the calendar icon (c) to select the desired period. You can also type directly in the calendar field (d). In that case, confirm your input by pressing Enter on your keyboard. |
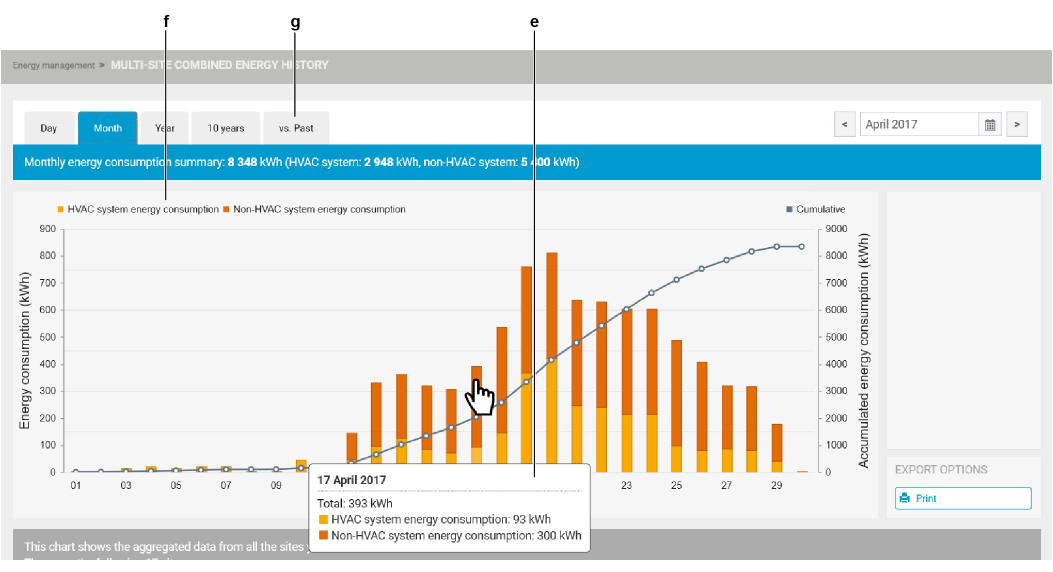
3 | Hover your cursor above the energy consumption bars to see the details (e). |
4 | You can hide information by clicking the legend (f). |
5 | To compare energy consumption of preceding years, click the tab (g). |
- Result: 2 calendar fields become available allowing you to select the 2 years you want to compare.
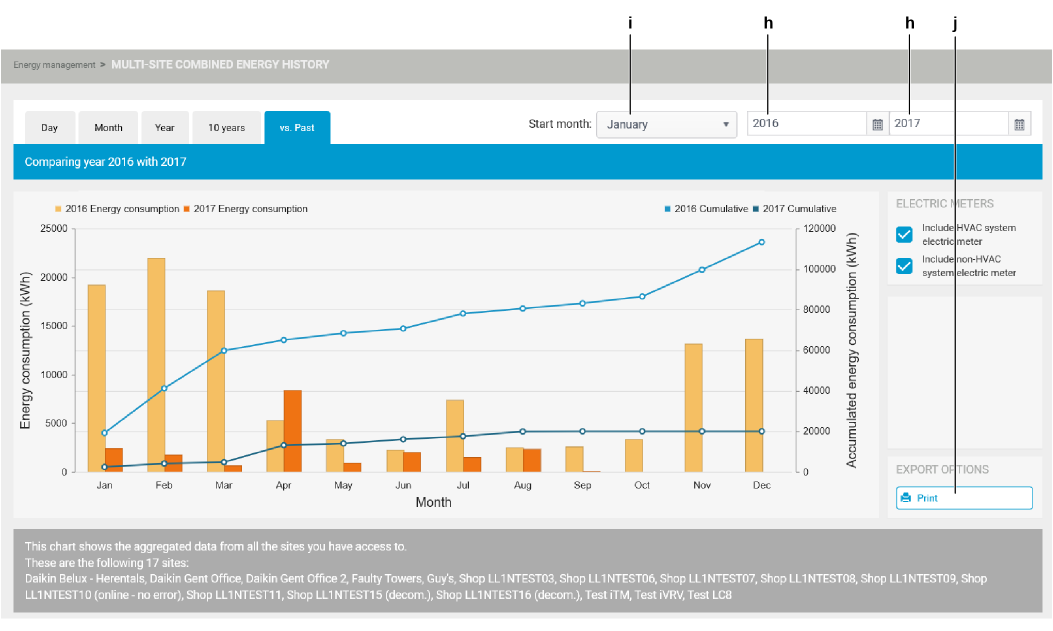
6 | Select the years you wish to compare (h). You can also choose the starting month (i): this will only determine which month is shown at the left of the chart, a complete year is of course still shown. |
7 | You can click the chart to directly jump to an underlying period (in each chart, except on day level). For example, in the Year chart you can click any of the month bars to view the detail chart of that month. |
8 | You can print the displayed information by clicking the corresponding button (j) at the bottom right. |
