To consult energy consumption of sites
1 | From the site selector, select the site you wish to manage first. |
2 | In the navigation pane, select underneath . |
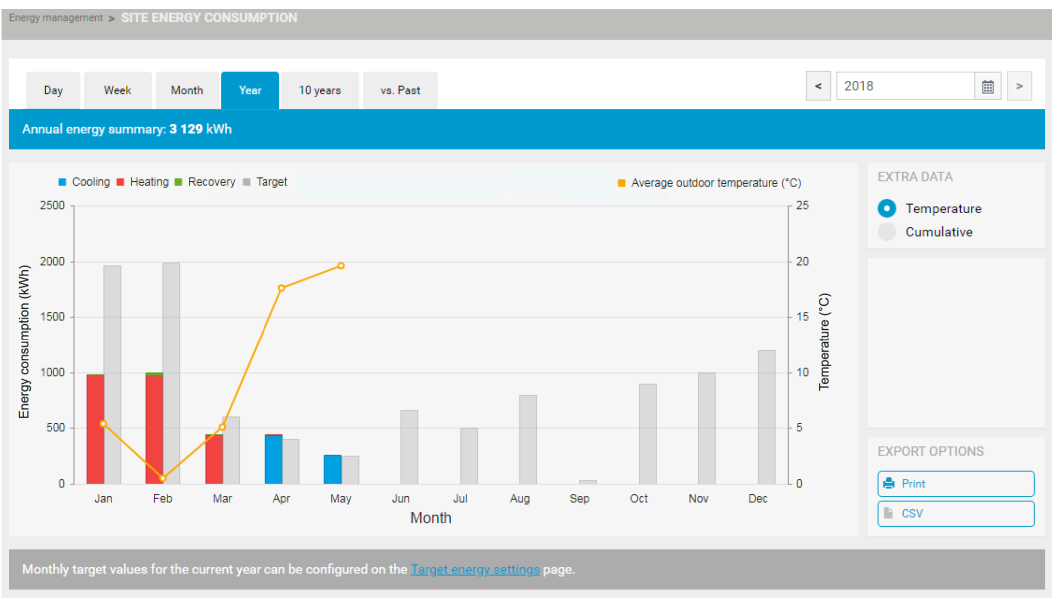
- Result: The calculated of the current year is displayed.
- Result: You can see the consumption of the cooling (in blue), the heating (in red), the heat recovery (in green), average outdoor temperature (°C) (in yellow) and the target value for each month (in grey). Refer to To manage the energy target settings if the target values are not shown.
3 | If in a period there were both, for example, heating and heat recovery you can hide 1 of both by clicking the legend. |
- Result: The label will be greyed out (a) and the values are hidden as shown below. When you hover your cursor above the energy consumption bars the details (b) are shown.
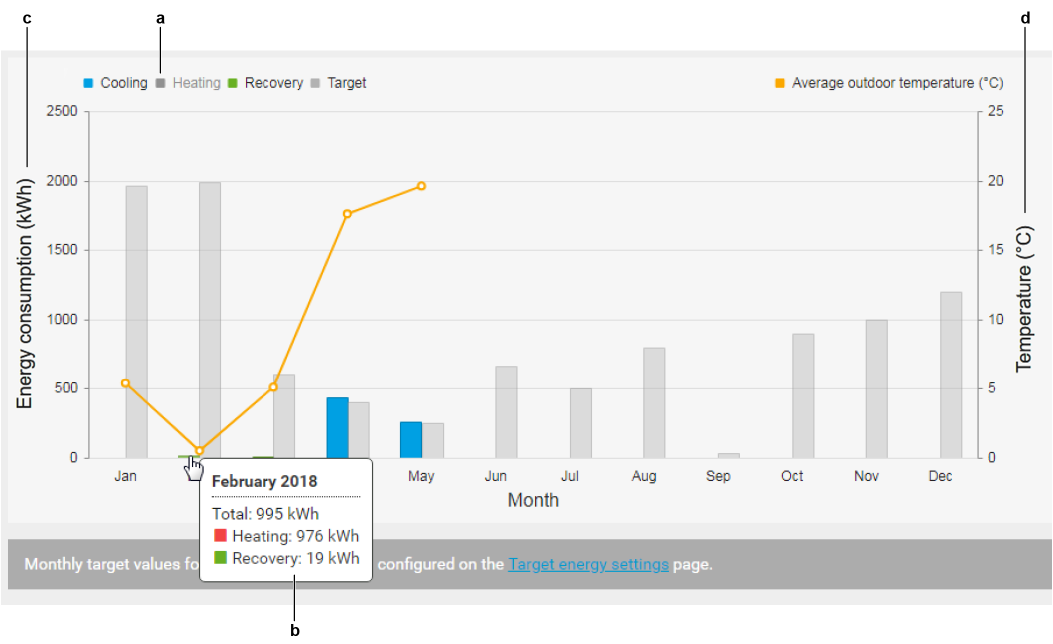

The left Y-axis (c) always shows the Energy consumption (kWh). The scale might change as you hide one of the values. This might give the impression the values changed.
The right Y-axis shows the (d) if you choose the option (j) in the field (i), or the (l) if you choose the option (k) in the field (i).
If charts contain a dashed line it means there is a gap: the unit was off and could not do any measurements.
4 | Click the legend once more to show the information again. |
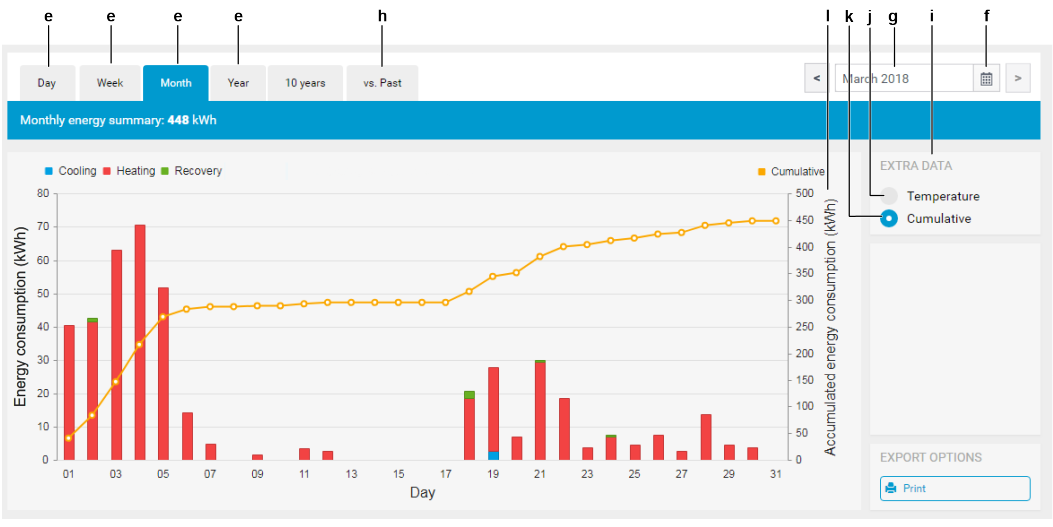
5 | To consult the energy consumption of another period (day, week, month, year), select one (e) at the top left of the section. Then click the calendar icon (f) to select the desired day, week, month or year. You can also type directly in the calendar field (g). In that case, confirm your input by pressing ENTER on your keyboard. |
6 | To compare energy consumption of preceding years, click the tab (h). |
- Result: 2 calendar fields (m) become available allowing you to select the 2 years you want to compare.
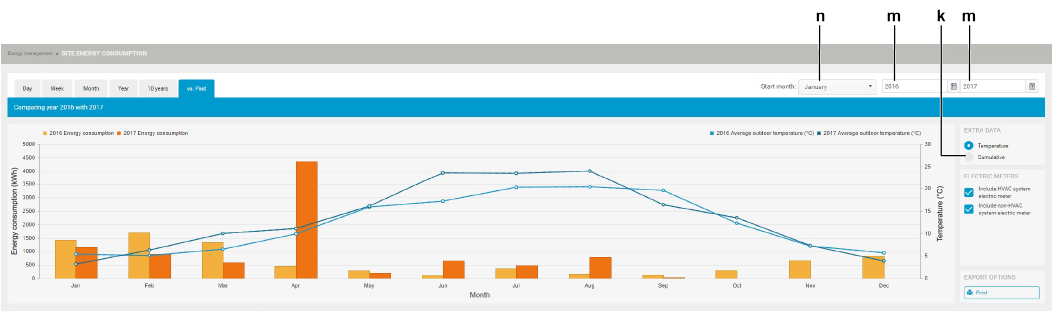
7 | Select the years you wish to compare. You can also choose the starting month (n): this will only determine which month is shown at the left of the chart, a complete year is of course still shown. |
When comparing with the current year, ONLY data up to last complete month is taken into account.
8 | If needed you can display the accumulated energy consumption by clicking the option (k) at the right of the section. |
