About the dashboard
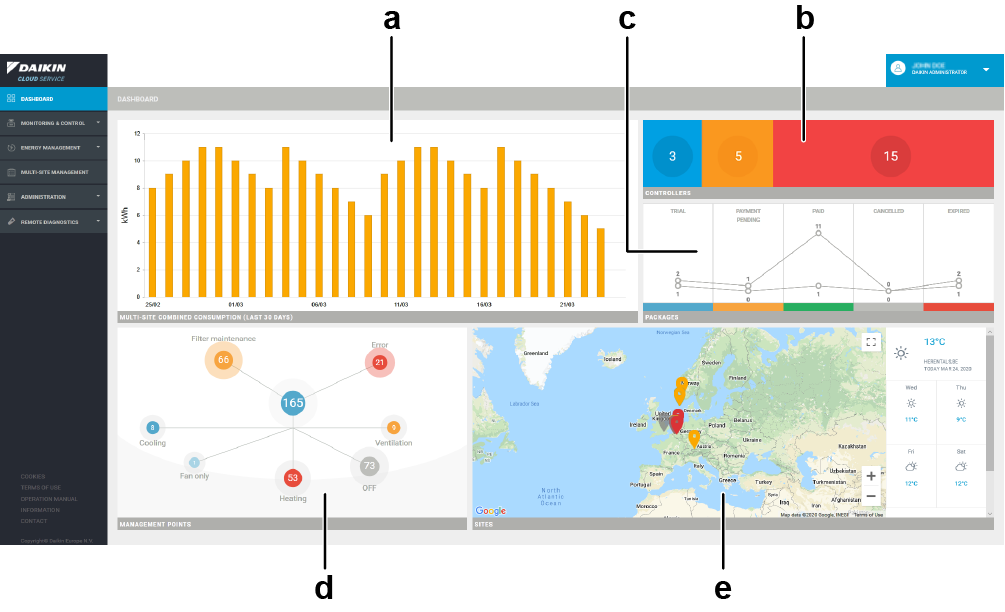
The screen is divided into 5 sections:
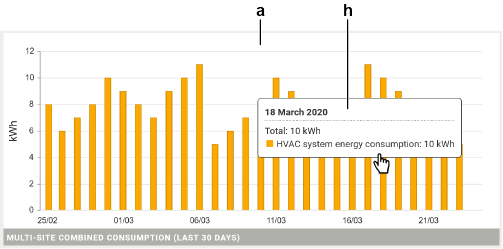
- The section (a). This chart shows the aggregated data from all the sites you have access to for the last 30 days. Hover your cursor over the chart to display additional information (h).
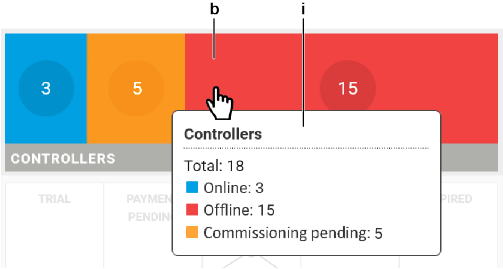
- The section (b). Here you can view the number of commissioned online, commissioning pending and commissioned offline controllers (blue = online, orange = commissioning pending and red = offline). Move your cursor into the section to display additional information (i).
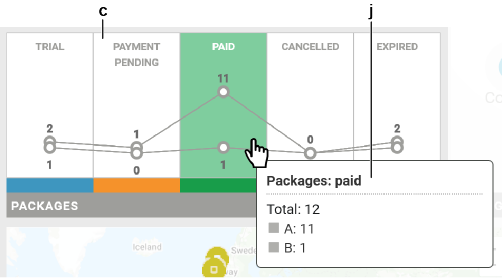
- The section (c). Here you can see the number of "A" and "B" packages and their status. See To create a new site and About editing sites for more information about packages and their status. Move your cursor into the section to display additional information (j).
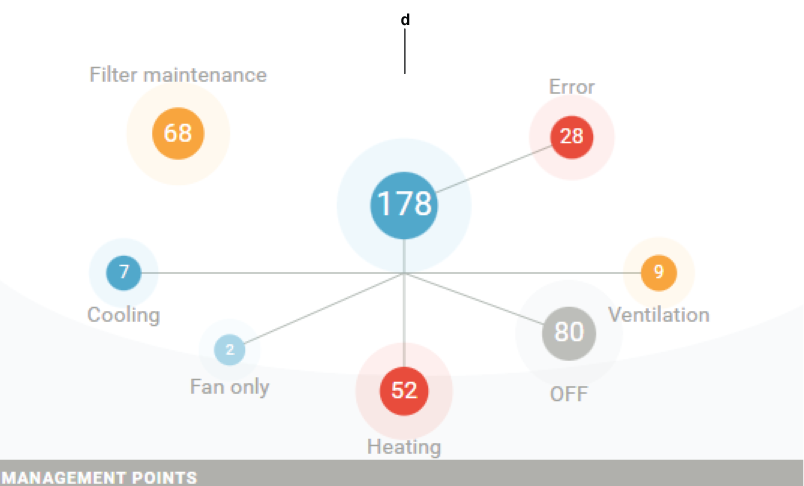
- The section (d), showing the current status of all units.
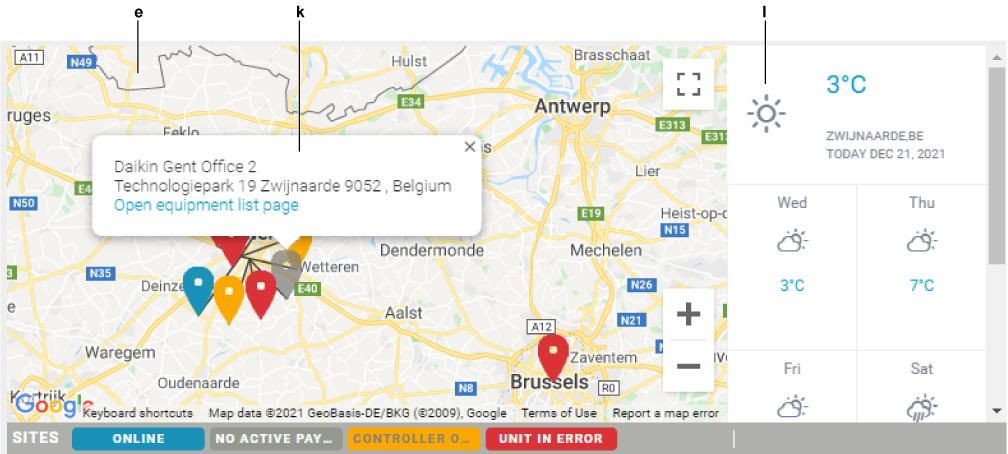
- The (e). The map gives an overview of all your sites (red = unit error, orange = controller error and blue = all OK). Click on a site location to display additional information about the site (k) and to display the weather forecast for that location (l).