To perform sensor monitoring
The section of the application allows you to monitor a variety of parameters relating to indoor air quality, environmental comfort and electromagnetic pollution. In order to do this, an IEQ sensor (indoor environmental quality sensor) needs to be paired.

If no sensors have been linked with a specific site before, the section will only display the following message: For more information about pairing an IEQ sensor with a site, see To pair IEQ sensors with a site.
The measured parameters are subdivided into 3 major categories:
Air quality | Environmental comfort | Electrosmog |
|---|---|---|
|
|
|
The parameter values of each category are combined into a category value which is representative of all parameters of that category. The 3 category values are then also combined into a value that gives an indication of the overall indoor air quality. You can also find more information about all sensor values and their abbreviations by clicking the information symbol under a sensor while in the . See To monitor IEQ sensors for more information.
1 | In the navigation pane, select under . |
2 | From the site selector (a), select the site you wish to manage first. Also select the sensor you want to display data for from the sensor selector (b). |
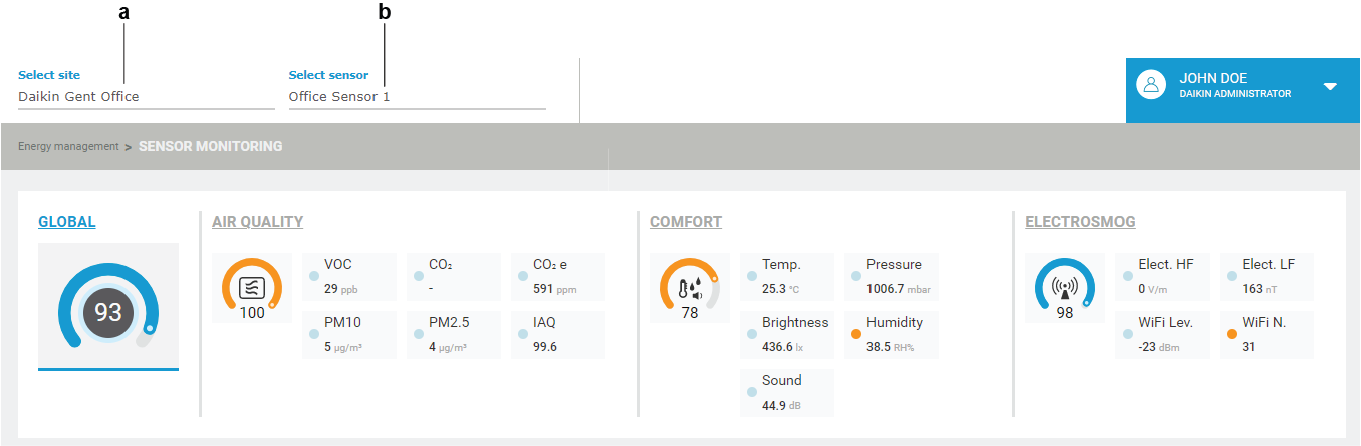
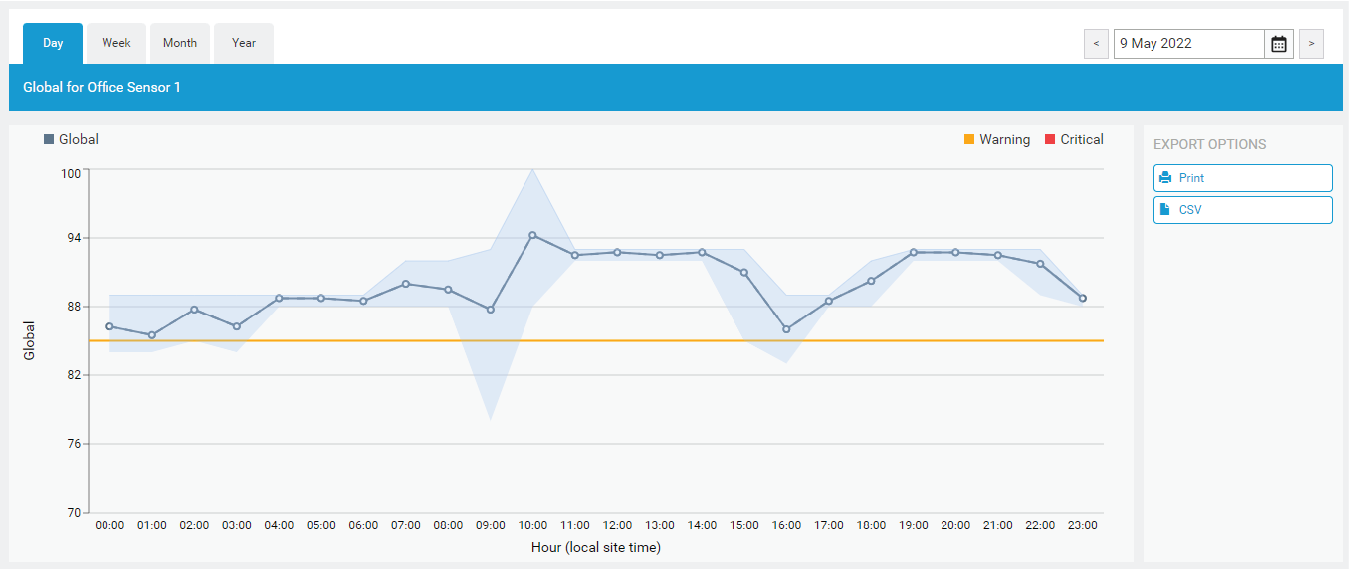
- Result: The of the current day for one particular IEQ sensor is displayed. By default, the combined value is displayed first.
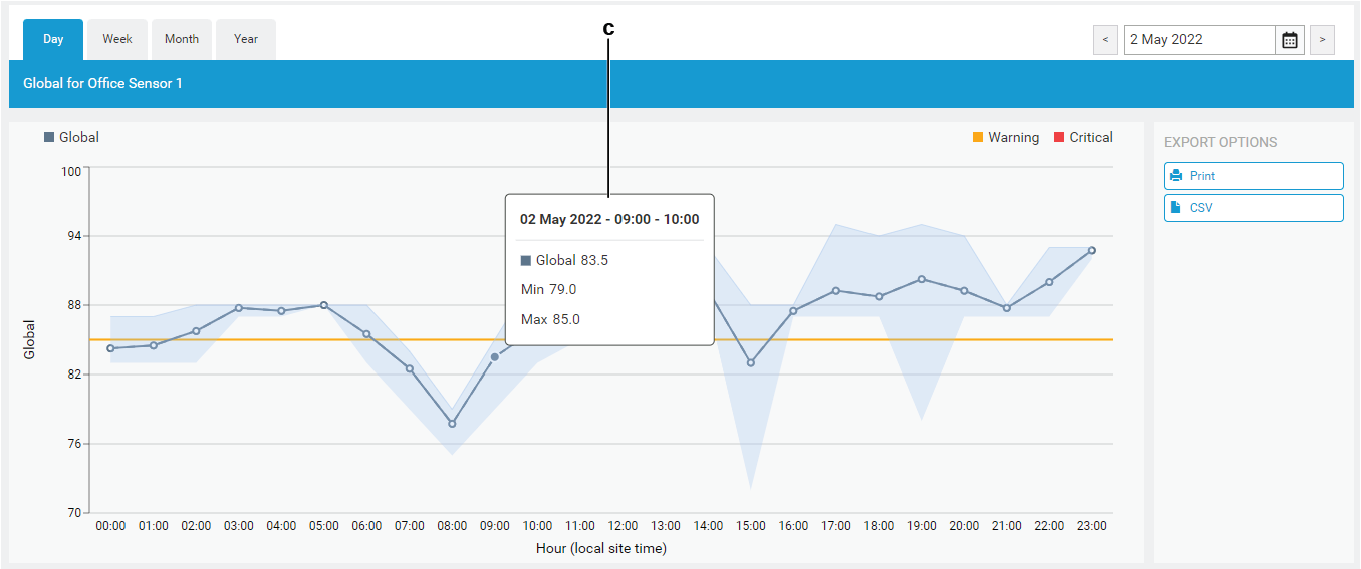
3 | Hover with your cursor over the chart to display (c) the measured information. In addition to an average, the graph also displays minimum and maximum measured values. |
4 | From the top section on the page, select which parameter you would like to display data for by clicking its tile (d). For categories with combined values, e.g. , , , or ), you can click either the tile or the text itself. |
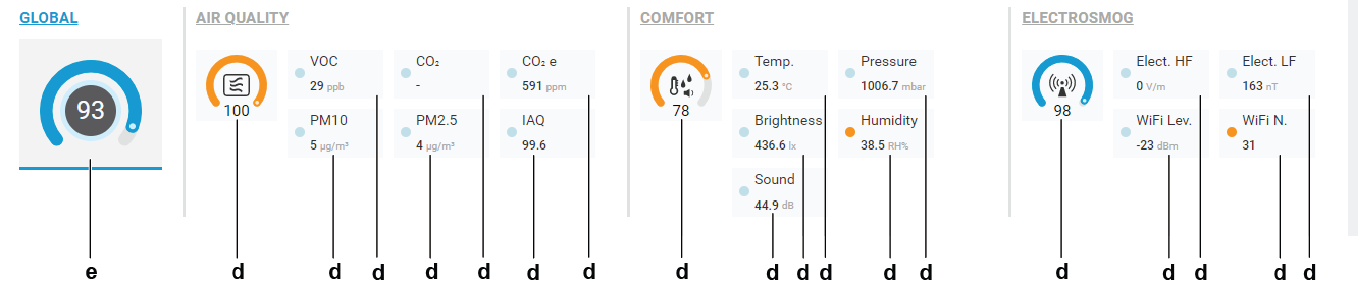
- Result: The selected parameter or category shows a blue line under its tile (e).
5 | Depending on which parameter or category is currently selected, any set (f) and (g) threshold values are visualised on the graph. |
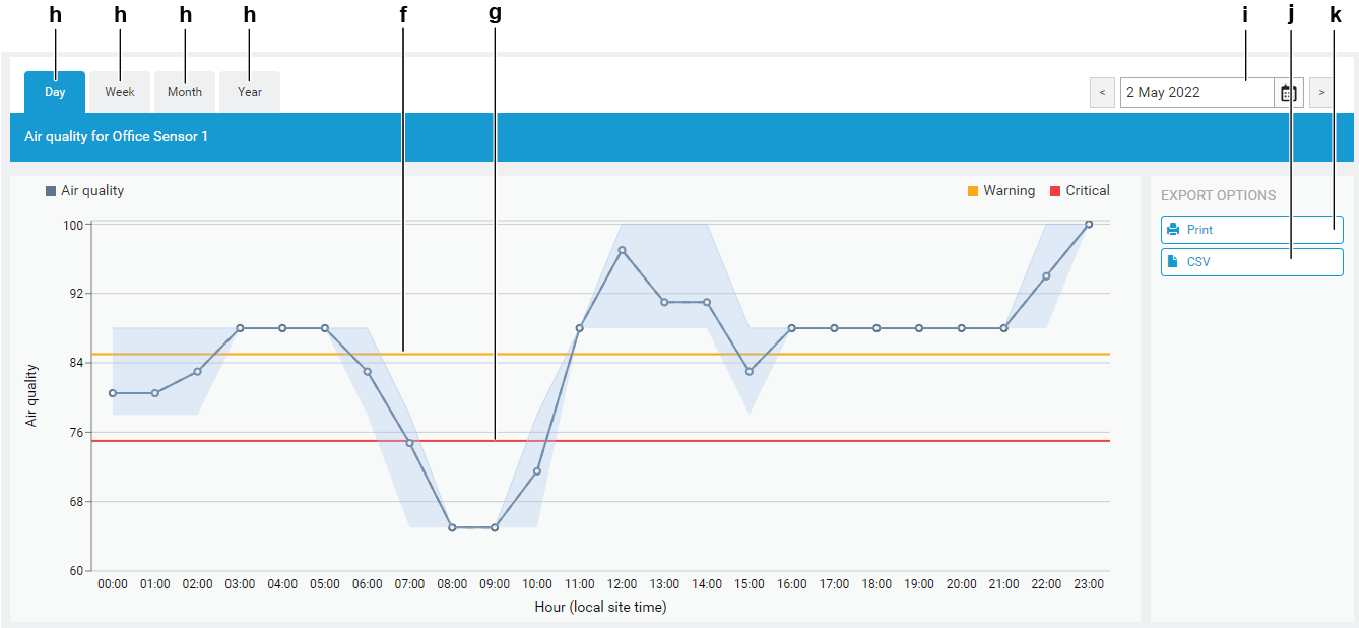
6 | If you want to consult the data for another period, select , , or (h) from the top to switch views. |
7 | You can display the data for a specific date using the date selector (i). Click the arrow keys to go back or forward in time, or click the calendar icon to go to a specific time period. |
8 | You can export the displayed information to CSV format by clicking the button (j) at the bottom right. Alternatively, you can also choose to print out the currently visible graph by clicking the corresponding button (k). |
